
Reduce CBAM Costs: 4 Strategies for Exporters
Key Takeaways
- This guide covers guide reporting requirements based on IR (EU) 2025/2621 and EU Regulation 2023/956
- All emission factors and CN codes referenced are verified against the latest EU implementing regulations
- Practical steps and common mistakes are drawn from hands-on implementation experience with the CbamTrack platform
From the team behind CbamTrack
We built this guide based on hands-on experience implementing CBAM compliance for SME importers. The calculations and workflows described here power our own platform — this is not theory, it's what we ship.
The €12,000 Question: How Much Can You Actually Save?
Here's a number that surprises most SME exporters: the difference between using EU default values and providing your own verified emissions data can be €12,000 or more per year for a typical steel exporter — by 2034, when free allocation ends.
In 2026, with the correct CBAM formula (embedded emissions − benchmark × 97.5%), the savings from efficient production are substantial from day one:
| Scenario | Emissions Factor | 2026 Cost (correct formula) | 2034 Cost (100%) |
|---|---|---|---|
| EU default value (BF-BOF) | 2.30 t CO₂/t | €14,460 | €34,500 |
| Your actual data (efficient) | 1.50 t CO₂/t | €2,460 | €22,500 |
| Annual savings | — | €12,000 | €12,000 |
2026 formula: (Emissions − 1.370 × 97.5%) × 200t × €75. BF-BOF benchmark: 1.370 tCO₂/t. ETS price ~€75/tCO₂.
This post gives you four practical strategies to reduce your CBAM costs.
Strategy 1: Provide Actual Emissions Data (Not Defaults)
Impact: HIGH | Effort: MEDIUM | Savings: 20-40%
This is the single most impactful thing you can do. When you don't provide verified emissions data, your EU importer uses EU default values — which are deliberately conservative (i.e., higher than most actual emissions).
Default Value Markup by Year
| Year | Default Value Markup |
|---|---|
| 2026 | +10% above the default value |
| 2027 | +20% above the default value |
| 2028 | +30% above the default value |
| 2029+ | +30% above the default value |
Default values carry an extra markup on top: 10% in 2026, rising toward 30% by 2028. This means using defaults isn't just less accurate — it's deliberately more expensive.
What You Need to Collect
| Data Point | Why It Matters | How to Get It |
|---|---|---|
| Production route (BF-BOF, EAF, DRI) | Determines base emission factor | Mill records |
| Energy consumption (electricity, gas, coal) | Direct emissions calculation | Utility bills |
| Raw material inputs | Precursor emissions | Procurement records |
| Electricity source | Grid emission factor | Supplier contracts |
Real Example: Steel Rebar (CN 7214) from Turkey
Based on EUA price of ~€75/tCO₂ (2026 estimate)
| Data Type | Emissions Factor | 2026 Cost per 100t (correct formula) | 2034 Cost per 100t (100%) |
|---|---|---|---|
| EU default (Turkey, BF-BOF) | 2.10 t CO₂/t direct | €5,730 | €15,750 |
| Actual data (efficient EAF) | 0.350 t CO₂/t direct | €2,100 | €2,625 |
| Savings | — | €3,630 per shipment | €13,125 per shipment |
2026 formula: (Emissions − Benchmark × 97.5%) × 100t × €75. BF-BOF benchmark: 1.370. Scrap-EAF benchmark: 0.072 (IR 2025/2621).
Note: The EU default value for Turkish BF-BOF steel is higher than many facilities' actual emissions. Providing verified data from your efficient EAF process saves money.
Strategy 2: Optimise Your Production Route
Impact: VERY HIGH | Effort: HIGH | Savings: 40-70%
The production route is the single biggest determinant of your CBAM cost. If you have flexibility in how you produce, this is where the largest savings come from.
Steel Production Routes Compared
| Route | Emissions (t CO₂/t) | 2026 Cost (after benchmark deduction) | 2034 Cost (100%) | vs. BF-BOF |
|---|---|---|---|---|
| BF-BOF (blast furnace) | 1.85 – 2.30 | €38.55 – €72.30/t | €139 – €173/t | Baseline |
| DRI-EAF (direct reduced iron) | 1.10 – 1.50 | €47.33 – €77.33/t | €83 – €113/t | -35% |
| Scrap-EAF (recycled) | 0.40 – 0.70 | €24.75 – €47.25/t | €30 – €53/t | -45% |
Formula: (Emissions − Route benchmark × 97.5%) × €75. Benchmarks: BF-BOF 1.370, DRI-EAF 0.481, Scrap-EAF 0.072 (IR 2025/2621).
Note: These ranges represent full production route emissions. Actual figures vary by facility efficiency, raw material mix, and energy sources.
Aluminium Production (Annex II)
Under CBAM, aluminium costs are driven by direct emissions only (anode consumption + PFC emissions) — electricity source does not affect the CBAM obligation for this sector.
| Period | Direct Emissions (t CO₂/t) | Cost per tonne (correct formula) |
|---|---|---|
| 2026 (after benchmark deduction) | 1.4 – 2.0 | €0.98 – €45.98/t |
| 2034 (100% liability) | 1.4 – 2.0 | €105 – €151/t |
2026 formula: (Direct emissions − 1.423 × 97.5%) × €75. Aluminium benchmark: 1.423 tCO₂/t. At 1.4 tCO₂/t, emissions are below the benchmark threshold (1.387 after deduction), resulting in near-zero cost. At 2.0 tCO₂/t, the full excess is chargeable.
Note: Unlike steel, aluminium's CBAM cost is largely fixed by the production process (electrolysis chemistry), not by electricity procurement choices. Savings for aluminium exporters come primarily from improving electrolysis efficiency and reducing PFC emissions.
Actionable Steps
- Audit your current production route — What's your actual emission intensity?
- Explore alternative fuels — Can you switch from coal to gas or renewables?
- Increase scrap usage — For steel producers, every 10% increase in scrap ratio reduces emissions
- Consider renewable PPAs — Power purchase agreements for electricity
Strategy 3: Claim Carbon Price Deductions
Impact: MEDIUM | Effort: LOW | Savings: Variable (depends on national carbon price)
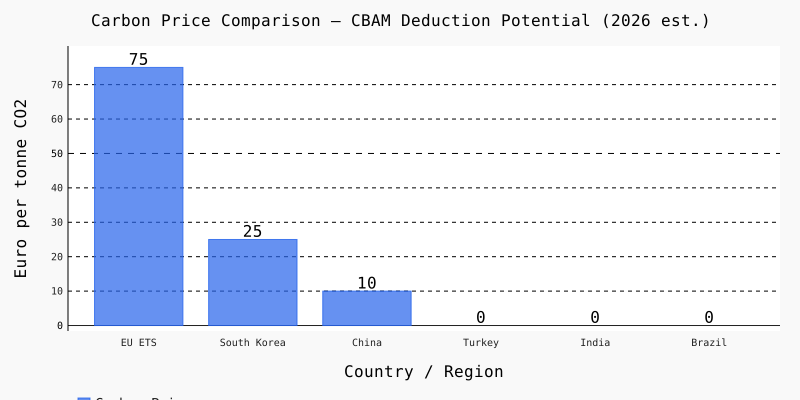
If your country has a carbon pricing mechanism (carbon tax, ETS, or similar), you can deduct the carbon price already paid from your CBAM obligation.
Countries with Carbon Pricing That Qualify for Deduction
| Country | Carbon Price (2026 est.) | Potential Deduction |
|---|---|---|
| China (national ETS) | ~€10/tonne CO₂ | Partial deduction |
| South Korea (K-ETS) | ~€25/tonne CO₂ | Partial deduction |
| Turkey (planned ETS) | TBD (expected 2025-2026) | Future deduction |
| India (planned carbon tax) | TBD | Future deduction |
| Brazil (planned) | TBD | Future deduction |
How to Claim the Deduction
- Obtain official documentation of carbon price paid (tax receipt, ETS compliance certificate)
- Convert to EUR using the official exchange rate
- Submit to your EU importer with your CBAM declaration
- Keep records for at least 5 years (audit trail)
Example: If you pay €25/tonne CO₂ in your country's ETS, and your CBAM liability is €75/tonne, your net CBAM cost is €50/tonne — a 33% reduction.
Strategy 4: Improve Energy Efficiency
Impact: MEDIUM | Effort: MEDIUM | Savings: 10-25%
Every unit of energy you save directly reduces your embedded emissions. This isn't just good for the environment — it's good for your CBAM bill.
Quick Wins for Energy Efficiency
| Action | Typical Energy Saving | CBAM Impact |
|---|---|---|
| Insulate furnaces and pipes | 5-10% fuel reduction | 5-10% emission reduction |
| Recover waste heat | 3-8% energy savings | 3-8% emission reduction |
| Optimise production scheduling | 2-5% energy savings | 2-5% emission reduction |
| Upgrade to efficient motors | 3-7% electricity savings | 3-7% indirect emission reduction |
| LED lighting & smart controls | 1-3% electricity savings | Minor but cumulative |
The Compounding Effect
| Efficiency Improvement | 2026 Savings (correct) | 2030 Savings | 2034 Savings |
|---|---|---|---|
| 5% energy reduction | €1,388 | €1,758 | €1,850 |
| 10% energy reduction | €2,775 | €3,516 | €3,700 |
| 15% energy reduction | €4,163 | €5,273 | €5,550 |
Based on a 200t steel exporter at the BF-BOF low end (1.85 tCO₂/t). 2026 savings: (Emissions reduction × 200t × €75). ETS price estimates: €75 (2026), €95 (2030), €100 (2034).
Combined Strategy Impact
Here's an illustrative scenario showing what happens when a 200-tonne steel exporter applies all four strategies together, viewed through the 2034 lens (when full liability kicks in):
Starting point: BF-BOF production, EU default values → €34,666/year
| Step | Action | Resulting Emissions Factor | 2034 Cost |
|---|---|---|---|
| 1 | Switch to verified Scrap-EAF data (Strategies 1 + 2 combined) | ~0.55 t CO₂/t | ~€8,290 |
| 2 | Apply a 10% energy efficiency gain (Strategy 4) | ~0.50 t CO₂/t | ~€7,536 |
| 3 | Claim a home-country carbon price deduction of ~20% (Strategy 3) | — | ~€6,029 |
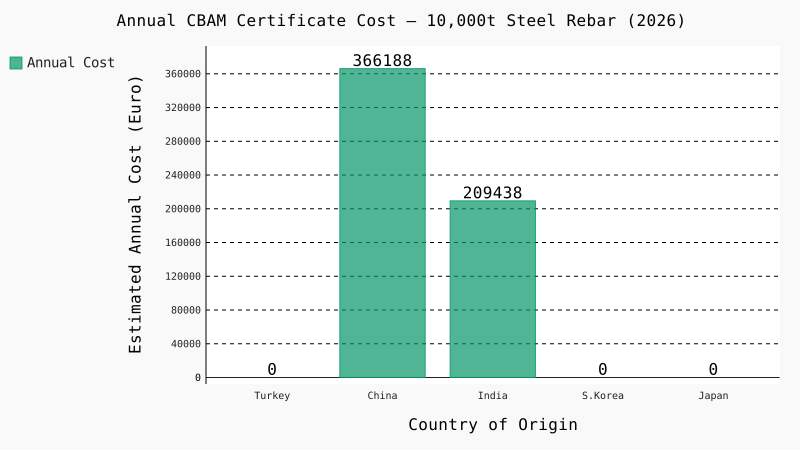
Result: from €34,666 down to roughly €6,000/year — a ~83% reduction.
Important: This is an illustrative scenario, not a guarantee. Your actual savings depend on whether switching production routes is feasible for your facility, whether your country's carbon price qualifies for deduction, and how much of your energy efficiency potential you can realistically capture. Treat the ~70-85% range as a ceiling to aim for, not a baseline to expect.
Key Takeaways
- Actual emissions data is the cheapest, most impactful strategy (saves 20-40%)
- Production route optimisation has the highest potential savings (40-70%)
- Carbon price deductions are often forgotten — claim them if eligible
- Energy efficiency improvements compound over time
- Combined strategies can realistically reduce costs by 70-85% for exporters with route flexibility
Track Your Numbers with CbamTrack
CbamTrack helps you apply all four strategies:
- Compare default vs. actual values — See your savings instantly
- Track ETS prices — Know your current and projected costs
- Generate reports — Ready-to-send data for EU customers
- Monitor deadlines — Never miss a reporting date
- Analyse anomalies — Catch data issues before they cost you
Start free — no credit card required. Try the free CBAM calculator or sign up at cbamtrack.com/sign-up
Sources
- EU Regulation 2023/956 — CBAM main regulation (Annex VIII phase-out schedule)
- IR (EU) 2025/2621 — Default emission values and steel/aluminium benchmarks
- IR (EU) 2025/2548 — CBAM certificate price calculation and publication
- IR (EU) 2025/2620 — Benchmark values for free allocation
- European Commission CBAM page
Last updated: July 2026 | Sources: EU Regulation 2023/956, CBAM Implementing Regulation 2025/2548, EU ETS Auction Data
Important Financial Disclaimer
The financial figures, cost estimates, and compliance scenarios discussed in this article are for informational purposes only. Actual CBAM liability depends on your specific import profile, verified emission data, and regulatory interpretations. Consult a qualified CBAM advisor or customs professional before making compliance decisions.
This article was researched and written with AI assistance. Figures and regulatory references are cross-checked against official EU sources (EUR-Lex, European Commission CBAM page) and updated when the rules change.
R. Emrah Gökkaya
I built CbamTrack because I saw SME exporters struggling with spreadsheets and confusing regulations. Every article here reflects what I've learned implementing IR 2025/2621-compliant calculations, integrating live EU ETS pricing, and building the emission factor database that powers our platform.
View full author bio →Ready to simplify your CBAM compliance?
Subscribe today and generate your first CBAM report in minutes.