Back to Home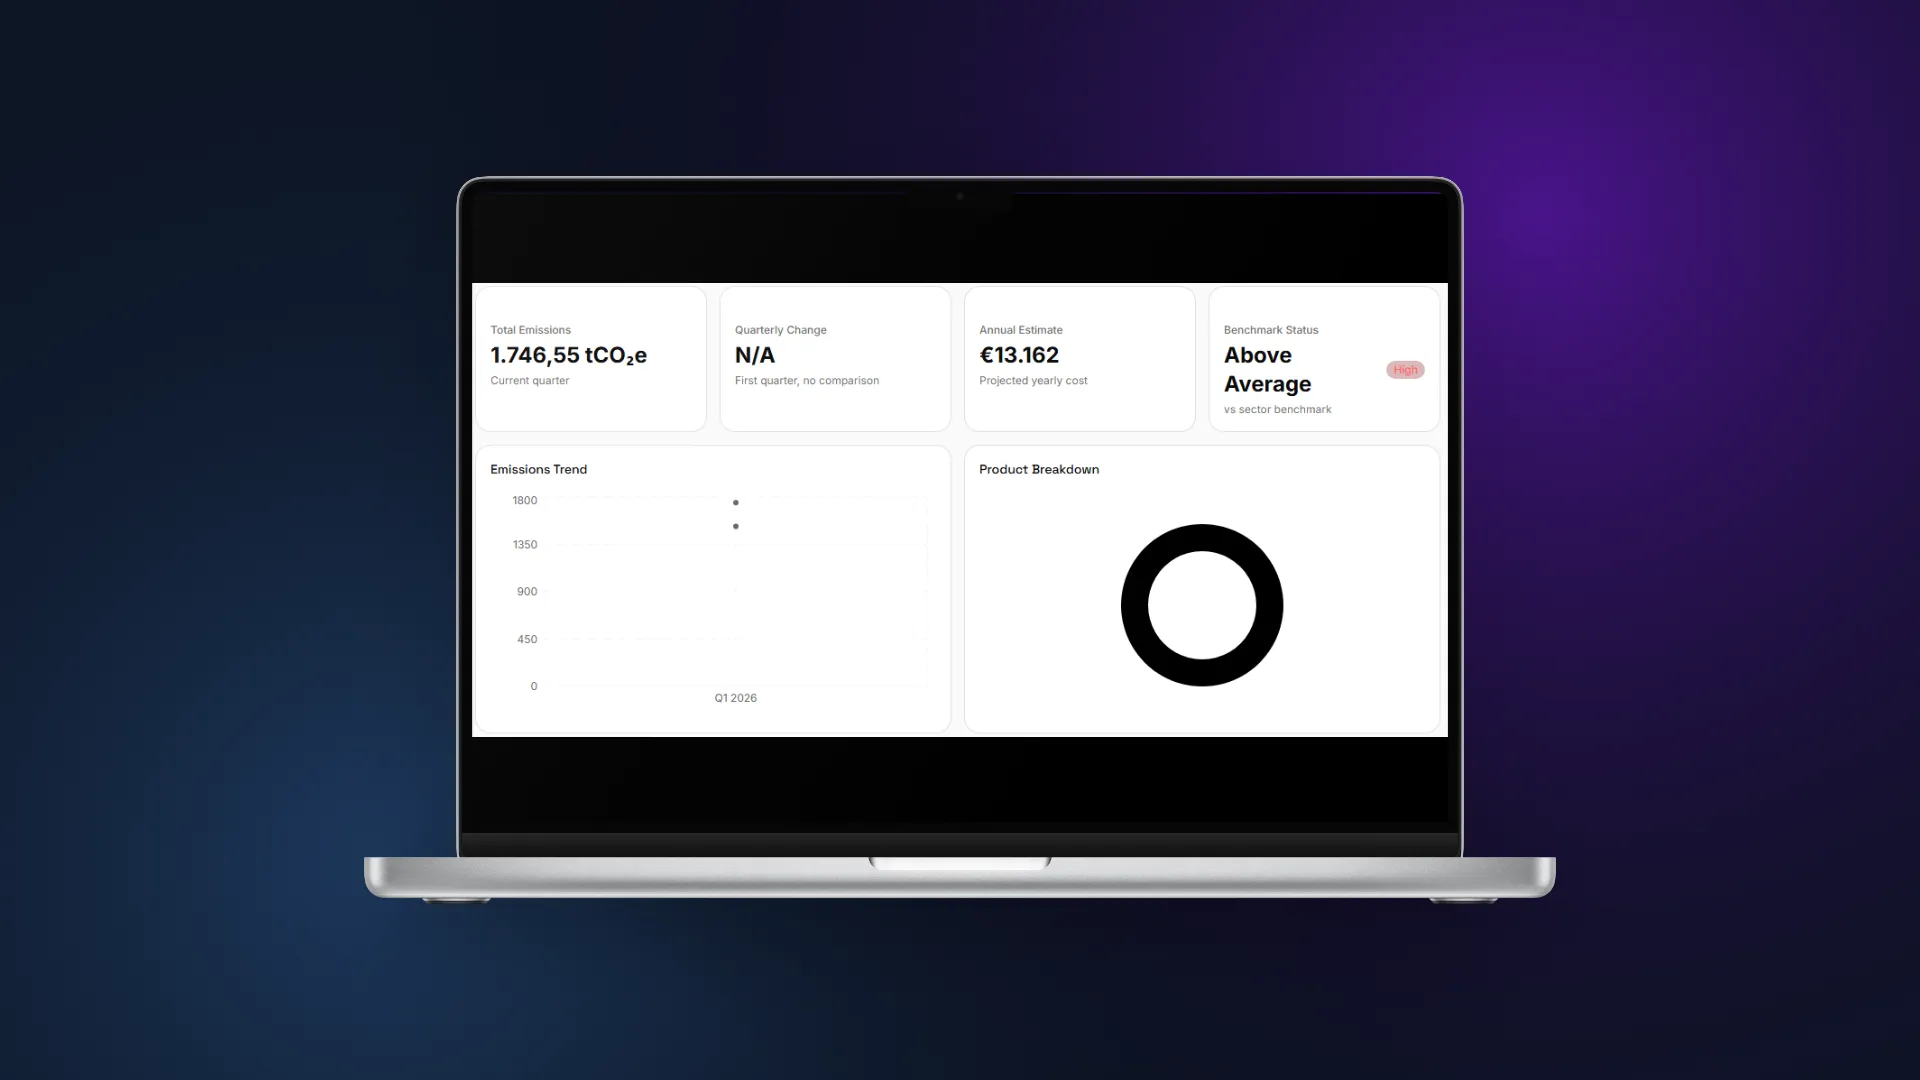
Feature
Emissions Analytics
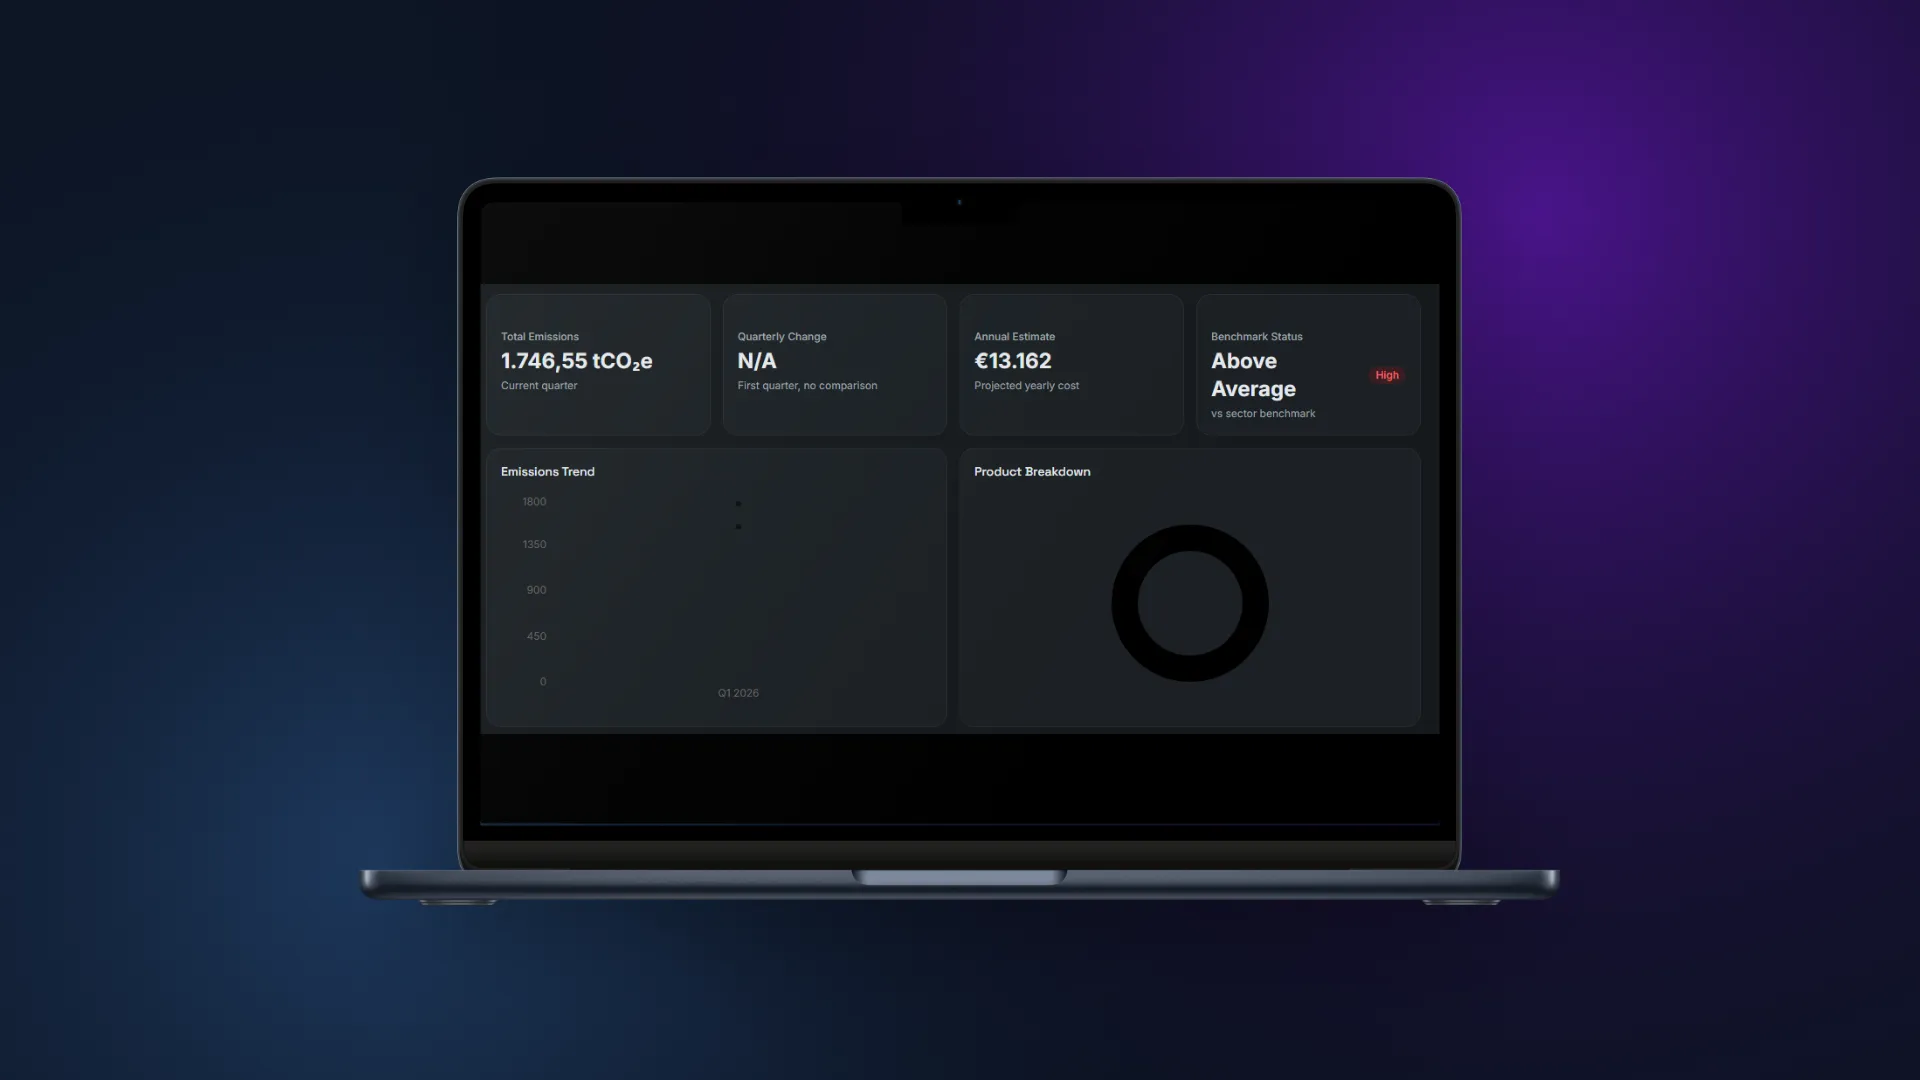
Track your CBAM emissions trends, compare products against sector benchmarks, and project costs through 2034 — all in one dashboard.
Quarterly Emissions Trend
See your emissions trajectory over time with stacked area charts showing direct and indirect emissions separately. Identify trends, spot anomalies, and understand how your quarterly performance evolves. The trend view helps you answer: “Are we improving or getting worse?”
Product Breakdown
Understand which products contribute most to your CBAM liability. The donut chart shows emissions share per product, while the sortable table provides detailed metrics including CN codes, emissions, costs, and benchmark status. Click any product to drill down into specifics.
Benchmark Comparison
Compare your emission intensity against EU CBAM sector benchmarks. For steel, we track BF-BOF (1.37 tCO₂e/ton), DRI-EAF (0.48), and Scrap-EAF (0.072) routes. When you're above benchmark, the dashboard suggests actionable steps — like switching production routes or suppliers — to reduce your CBAM cost exposure.
Cost Projections (2026-2034)
Project your CBAM costs through 2034 using three ETS price scenarios (low, base, high). The chart combines CBAM phase-in factors with projected EU ETS prices to show your potential liability at each year. This is the planning tool that CarbonChain charges enterprise prices for — included in CbamTrack's Starter plan at €79/month.
Start tracking your emissions today
Emissions analytics is included in the Starter plan at €79/month. No credit card required to start.