CBAM for Gulf/MENA Steel & Aluminium Producers
Key Takeaways
- This guide covers industry guide reporting requirements based on IR (EU) 2025/2621 and EU Regulation 2023/956
- All emission factors and CN codes referenced are verified against the latest EU implementing regulations
- Practical steps and common mistakes are drawn from hands-on implementation experience with the CbamTrack platform
From the team behind CbamTrack
We built this guide based on hands-on experience implementing CBAM compliance for SME importers. The calculations and workflows described here power our own platform — this is not theory, it's what we ship.
If you run a steel or aluminium plant in the Gulf or MENA region and export to Europe, CBAM is already changing the numbers on your invoices. Starting in 2026, the EU's carbon border tax applies to every tonne of steel and aluminium shipped into Europe.
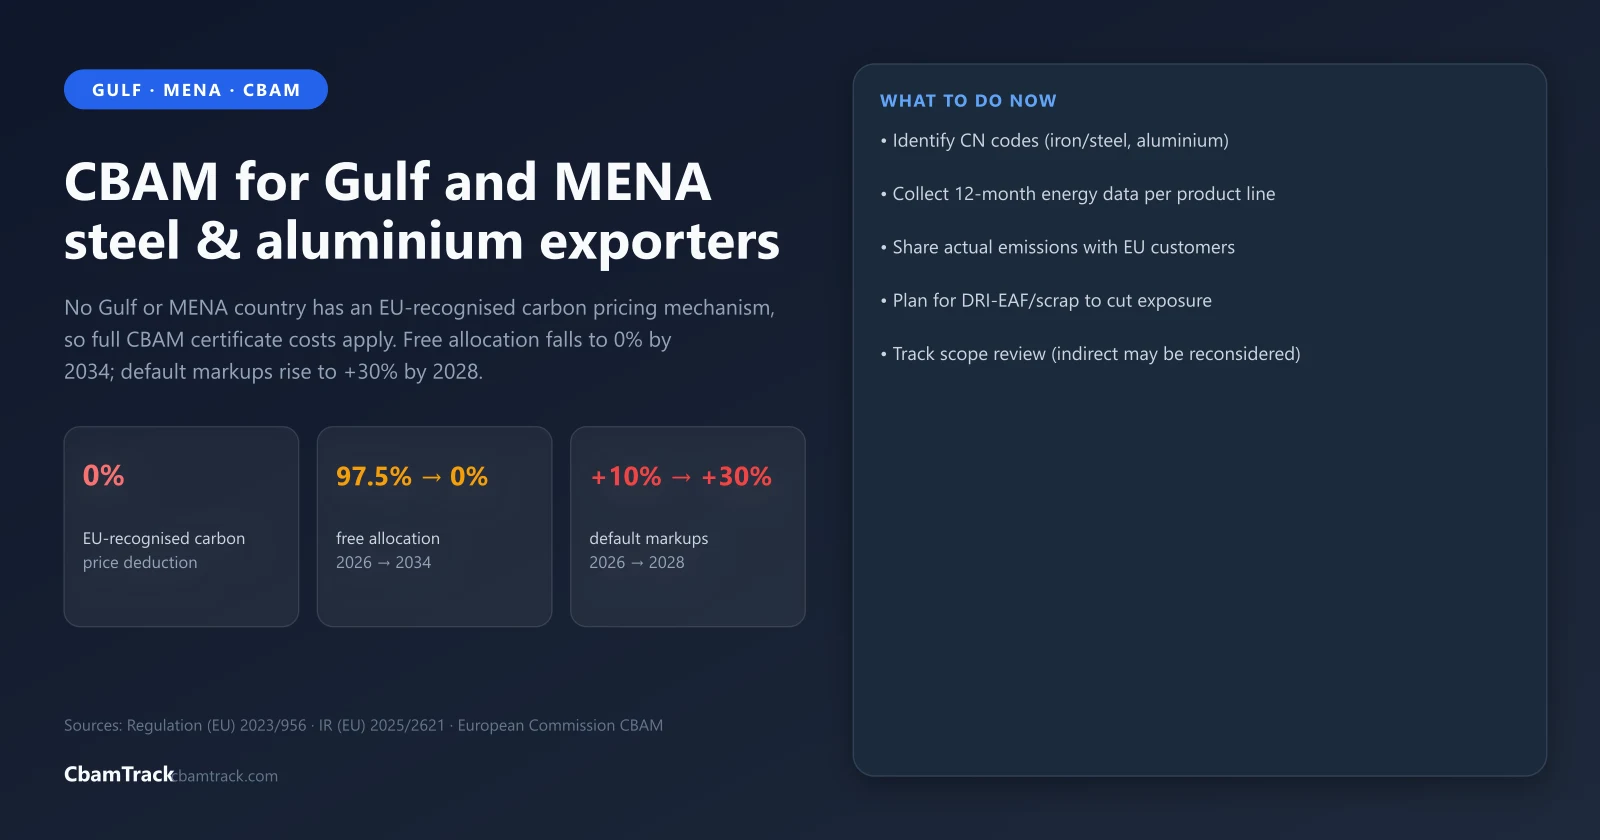
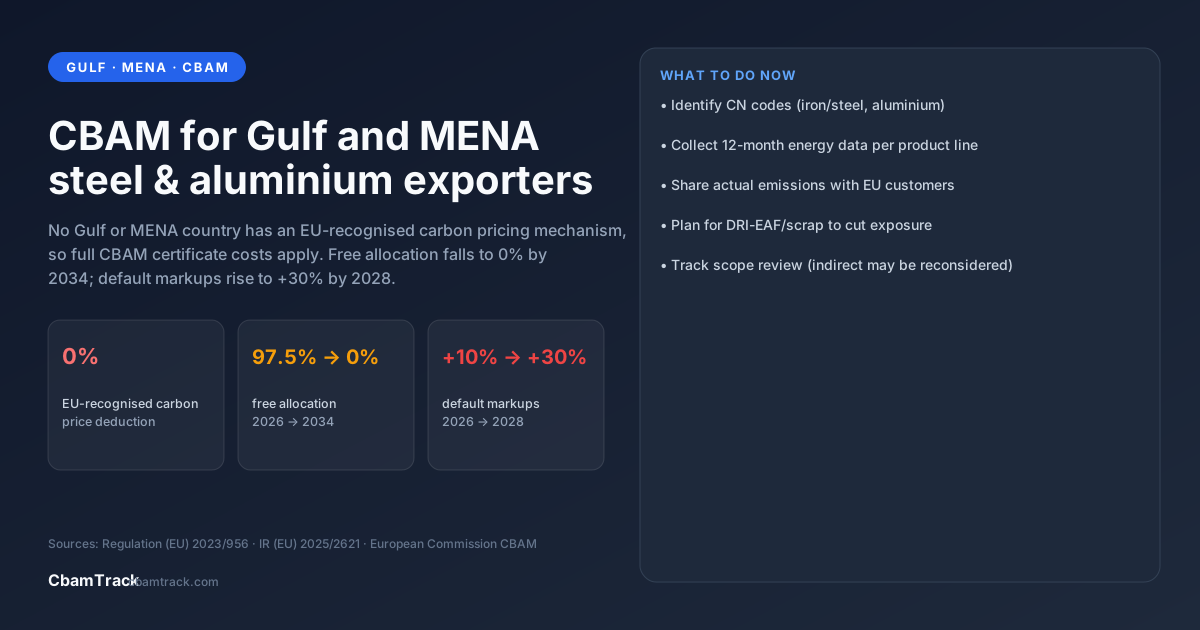
Gulf exporters face one clear hurdle: no Gulf or MENA country currently has an EU-recognised carbon pricing mechanism, so you can't deduct anything from your CBAM certificate cost. That makes cost control a matter of preparation, not assumption.
This guide lays out what that means, what it could cost, and what to do now.
TL;DR
- No deduction: Gulf and MENA producers have no EU-recognised carbon price to deduct, so the full CBAM certificate cost applies.
- Different rules: For aluminium, only direct emissions (smelting technology) are chargeable under Annex II. For steel, BF-BOF is most exposed.
- Rising costs: Free allocation falls from 97.5% in 2026 to 0% in 2034, while default value markups rise from +10% to +30% by 2028.
- Data matters: Providing actual emissions data is the simplest way to avoid default markups.
Why Gulf and MENA producers are uniquely exposed
| Factor | Gulf/MENA Reality | CBAM Impact |
|---|---|---|
| Aluminium production | Gas or coal-powered smelting | CBAM charges direct emissions only (Annex II); smelting technology matters more than the electricity source |
| Steel production | Mostly BF-BOF route | Higher benchmark exposure, so higher certificate costs |
| Carbon pricing | No national ETS or carbon tax | No deduction, so the full EU certificate price applies |
| EU market share | Significant (UAE, Saudi, Egypt) | Growing pressure on competitiveness against lower-carbon suppliers |
(Source: Regulation (EU) 2023/956, Article 9, carbon price deduction rules)
What your CBAM cost looks like
In 2026, CBAM applies a benchmark-based free allocation: Chargeable = Embedded emissions - (Benchmark x 97.5%). You get free allocation equal to 97.5% of the sector benchmark, and emissions above that benchmark are fully chargeable. That free allocation drops over time and disappears by 2034. The tables below show approximate per-tonne costs.
Steel producers
| Production Route | Emissions (t CO2/t) | 2026 Cost (97.5% free allocation) | 2034 Cost (0% free allocation) |
|---|---|---|---|
| BF-BOF (typical Gulf) | 1.85 to 2.30 | €38.74 to €72.65/t | €139 to €173/t |
| DRI-EAF (natural gas) | 1.10 to 1.50 | €47.55 to €77.70/t | €83 to €113/t |
| Scrap-EAF (recycled) | 0.40 to 0.70 | €24.87 to €47.48/t | €30 to €53/t |
2026 formula: (Emissions - Route benchmark x 97.5%) x €75.36. Benchmarks: BF-BOF 1.370, DRI-EAF 0.481, Scrap-EAF 0.072 (IR 2025/2621).
Aluminium producers
Important: Aluminium is an Annex II sector under Regulation 2023/956 Article 7(1). Only direct emissions from the smelting process are chargeable. Indirect emissions from electricity are reported but not charged, so smelting technology (pre-bake vs Søderberg) drives your CBAM cost, not your electricity source.
| Smelting Technology | Direct Emissions (t CO2/t Al) | 2026 Cost (97.5% free allocation) | 2034 Cost (0% free allocation) |
|---|---|---|---|
| Pre-bake (CWPB) | 1.50 to 1.70 | €8.52 to €23.59/t | €113 to €128/t |
| Søderberg (HSS) | 1.80 to 2.20 | €31.12 to €61.27/t | €136 to €166/t |
| Inert Anode (emerging) | <0.50 | €0/t (below benchmark) | <€38/t |
2026 formula: (Direct emissions - 1.423 x 97.5%) x €75.36. Aluminium benchmark: 1.423.
With aluminium, CBAM costs look similar whether you use gas, coal, or hydro power. The real differentiator is smelting technology. Gulf producers with modern pre-bake smelters can be competitive on CBAM costs even if they lack access to low-carbon electricity. Total (direct plus indirect) emissions can vary by a factor of 6 to 15, but under current rules that spread doesn't feed into certificate costs. Indirect emissions are reported for transparency only. The European Commission may review this during the 2027 to 2028 scope review, so it's worth tracking both.
What your EU customers need from you
EU importers must report the embedded emissions in every product they bring in. To do that accurately, they need data from you:
| Data Point | Why It's Needed |
|---|---|
| Production route (BF-BOF, DRI-EAF, etc.) | Determines which benchmark applies |
| Electricity consumption per tonne | Direct emissions calculation |
| Natural gas consumption | Process emissions |
| Coal or coke consumption | Blast furnace emissions |
| Electricity source (grid mix, gas plant, renewable PPA) | Grid emission factor |
If you provide this data, your EU customer can report actual emissions. If you don't, they use EU default values, which carry a markup starting at +10% in 2026 and rising to +30% by 2028 (IR (EU) 2025/2621). The choice is straightforward: provide data, or pay more.
Five steps to prepare
Step 1: Identify your CN codes
Check which of your products fall under CBAM:
- Iron and steel: CN Chapter 72-73
- Aluminium: CN Chapter 76
Step 2: Document your production routes
For each product, note the furnace type (BF-BOF, DRI-EAF, Scrap-EAF), energy sources (coal, gas, electricity), and key raw materials (iron ore, scrap, limestone).
Step 3: Collect energy data
Gather 12 months of data per product line:
- Electricity consumption (kWh per tonne)
- Natural gas consumption (m³ per tonne)
- Coal or coke consumption (kg per tonne)
Step 4: Know your grid factor
Gulf grid averages sit around 0.5 to 0.7 t CO2/MWh. If you have renewable power purchase agreements, you may have a lower factor to document.
Step 5: Prepare a communication sheet
Use the EU's standardised format to share your data with EU customers. It's the format most importers already expect.
What happens if you do nothing
| Timeline | Consequence |
|---|---|
| 2026 | EU customers use default values, adding a 10% markup |
| 2028 | Default markup reaches 30%, creating a clear cost disadvantage |
| 2030 | Chargeable share reaches 48.5% of the benchmark gap, so nearly half becomes liable |
| 2034 | Full liability; you pay for all embedded emissions above the benchmark |
Companies that prepare now will have an edge. Those that wait risk losing market share.
The short version
- Gulf and MENA producers have no carbon price deduction, so the full EU certificate cost applies.
- For aluminium, only direct emissions (smelting technology) are chargeable under Annex II, so costs look similar across different electricity sources.
- Providing actual emissions data is your biggest competitive advantage right now.
- EU customers will prefer suppliers who make compliance easy.
- Default values rise from +10% in 2026 to +30% by 2028, so using them gets more expensive over time.
Frequently asked questions
Does CBAM apply to all Gulf exports?
Only to products in the six CBAM sectors: iron and steel, aluminium, cement, fertilisers, hydrogen, and electricity. For Gulf exporters, steel and aluminium are the main categories.
How is the CBAM certificate price calculated?
The price is based on the quarterly average of EU ETS auction prices. In Q1 2026, it was €75.36 per tonne of CO2. (Source: European Commission, DG TAXUD)
Can Gulf countries get a carbon price deduction?
Only if your country establishes a carbon pricing mechanism that the EU recognises. Currently, no Gulf or MENA country has an EU-recognised carbon pricing mechanism.
What's the cheapest way to comply?
For most Gulf producers, providing actual emissions data to your EU customers is free and cuts their CBAM costs. A supplier data sheet or a compliant reporting tool can help you prepare that data without hiring a consultant.
Regulation status
| Field | Value |
|---|---|
| Last reviewed | 2026-07-27 |
| Based on | Regulation (EU) 2023/956, IR (EU) 2025/2621 |
| Applies to | CBAM permanent phase (2026+) |
References
- EU Regulation 2023/956
- IR (EU) 2025/2621
- European Commission CBAM Q&A
- Free CBAM cost calculator
- Complete CBAM guide
Last updated: July 27, 2026
Related: CBAM Certificate Cost Formula | CBAM Compliance: What to Do Right Now | What Is CBAM?
Important Financial Disclaimer
The financial figures, cost estimates, and compliance scenarios discussed in this article are for informational purposes only. Actual CBAM liability depends on your specific import profile, verified emission data, and regulatory interpretations. Consult a qualified CBAM advisor or customs professional before making compliance decisions.
This article was researched and written with AI assistance. Figures and regulatory references are cross-checked against official EU sources (EUR-Lex, European Commission CBAM page) and updated when the rules change.
R. Emrah Gökkaya
I built CbamTrack because I saw SME exporters struggling with spreadsheets and confusing regulations. Every article here reflects what I've learned implementing IR 2025/2621-compliant calculations, integrating live EU ETS pricing, and building the emission factor database that powers our platform.
View full author bio →Ready to simplify your CBAM compliance?
Subscribe today and generate your first CBAM report in minutes.