EU Chemicals: Why They Pay No Carbon Price
Key Takeaways
- This guide covers industry guide reporting requirements based on IR (EU) 2025/2621 and EU Regulation 2023/956
- All emission factors and CN codes referenced are verified against the latest EU implementing regulations
- Practical steps and common mistakes are drawn from hands-on implementation experience with the CbamTrack platform
From the team behind CbamTrack
We built this guide based on hands-on experience implementing CBAM compliance for SME importers. The calculations and workflows described here power our own platform — this is not theory, it's what we ship.
The free-ride problem in numbers
The European chemical sector is the EU's fourth-largest industrial emitter. That's a ranking the sector doesn't usually get singled out for. A 2026 Carbon Market Watch analysis makes a blunt claim: for most of its pollution, the sector has effectively paid no carbon price at all.
"With all the free allowances the European Union's chemical sector receives under the EU's Emissions Trading System, it effectively pays no carbon price for its pollution, which is grossly unfair and counterproductive." Carbon Market Watch, "Bad chemistry" (2026)
| Metric | Value |
|---|---|
| Chemical sector emissions 2013 to 2024 | 1.3 Gt CO₂e |
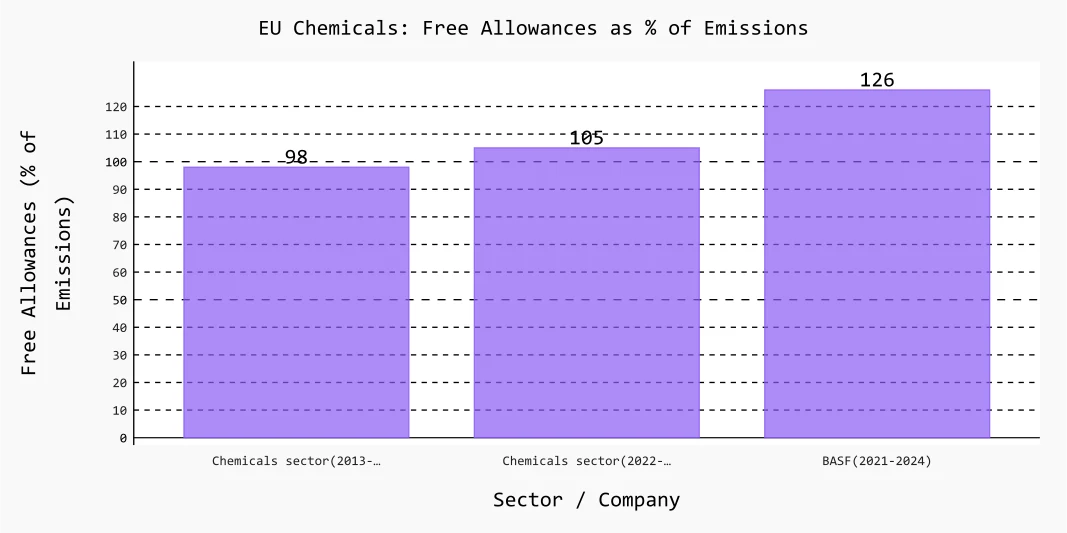
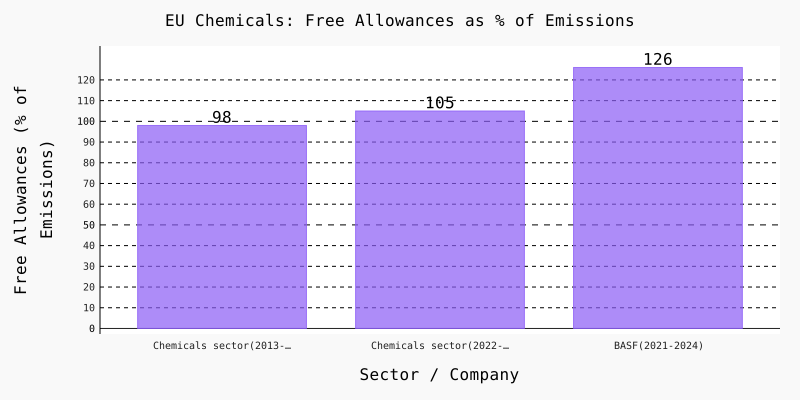
| Share of emissions covered by free allowances since 2013 | 98% |
| Allowances received in 2022 to 2023 (as % of emissions) | 105% (over-allocated) |
| Reduction in emissions 2013 to 2024 | 30% (but only 7% from plants that stayed open) |
| 2024 emissions trend | +4% (sector returned to growth) |
The picture gets starker when you look at the largest player.
The BASF case study
"BASF, the largest chemical company in Europe, has been profiting from free allowances covering 126% of its emissions from 2021 to 2024, while complaining about carbon prices and opposing any conditionality." Carbon Market Watch, "Bad chemistry" (2026)
| BASF metric | Value |
|---|---|
| Emissions since 2021 | 22 Mt CO₂e |
| Free allowances received | 28 million (≈€2 billion value) |
| Coverage vs. emissions | 126% |
| Share buyback programme (2025 to 2028) | €12 billion |
| New China mega-factory (Zhanjiang) | €9 billion |
The allowances alone are worth around €2 billion. That's not loose change, even for a company BASF's size. In the same stretch it's been running a €12 billion share buyback programme through 2028, and €9 billion is going into a new mega-factory in Zhanjiang, China.
Where the emissions actually are
| Subsector | Share of sector emissions |
|---|---|
| Other organic basic chemicals | 38% |
| Ammonia (fertilisers) | 18% |
| Fertiliser group (incl. nitric acid) | ~30% |
| Fossil fuel combustion (cross-cutting) | ~1/3 |
Emissions are geographically concentrated. The Netherlands (67 Mt), Germany (61 Mt) and France (46 Mt) together account for half of EU chemical emissions, and Antwerp's installations alone emit more than Italy's entire chemical sector.
Allowances pile up in the same few hands. Since Phase 4 began, 3% of companies have received 50% of the free allowances and 12% have received 80%. One in three companies receives more allowances than it needs.
CBAM's partial coverage: the 30% problem
CBAM was designed to replace free allowances with a border carbon price. In chemicals, it only reaches a fraction of the sector:
- Fertilisers and hydrogen are the only chemical products inside CBAM's scope (Annex I, Regulation 2023/956)
- These sectors will still receive 124 million free allowances from 2026 to 2034 (109M fertilisers plus 15M hydrogen) while CBAM phases in
- Around 70% of chemical sector free allowances have no phase-out date at all
| Scenario | Free allowances 2026 to 2034 (non-CBAM chemical sectors) |
|---|---|
| Phased out by 2034 (like CBAM sectors) | 220 to 344 million |
| No phase-out plan defined | Up to 519 to 642 million |
"Even parts of the chemicals industry that will enter CBAM are still receiving a lot of free allocation: fertilisers and hydrogen are set to get another 124 million free allowances from 2026 to 2034." Carbon Market Watch, "Bad chemistry" (2026)
Why this matters for the 2026 ETS revision
The EU ETS revision that starts in July 2026 is the natural moment to close this gap. The report recommends three things:
- Phase out free allowances on a clear timeline, and treat extending CBAM scope to cover all chemicals as the effective pathway
- Make benchmarks more ambitious. The average EU steam cracker is about 47 years old, and the report argues that the frontrunners should set the benchmark
- Attach decarbonisation conditionalities to any remaining free allowances, with clawback clauses
If you import fertiliser or hydrogen, you're already inside CBAM, and a downstream and chemicals expansion is being negotiated right now (see our mid-year 2026 update). Ammonia, urea, nitric acid, the other chemical feedstocks? The scope debate should reach you within the next two revision cycles.
The short version
- Chemicals received free allowances covering 98% of emissions since 2013, and 105% in 2022 to 2023
- BASF alone received allowances worth about €2 billion while covering 126% of its emissions
- CBAM currently covers only about 30% of chemical allowances (fertilisers plus hydrogen)
- The remaining 70% has no phase-out plan
- The July 2026 ETS revision is the key moment to close the gap
Related: What Is CBAM? | How to Calculate Embedded Emissions | EU ETS Price Tracker
Frequently asked questions
Does CBAM cover chemicals?
Only fertilisers and hydrogen so far. Other chemical products (olefins, organic basic chemicals, adipic acid) are not yet in CBAM's Annex I scope, though expansion is under negotiation.
Will free allowances for chemicals end?
Only for CBAM-covered goods, phased out via the CBAM factor to 2034. The other ~70% of chemical allowances have no defined end date unless the ETS revision changes this.
Why is the chemical sector the fourth-largest emitter?
Large energy-intensive processes (steam cracking, ammonia synthesis) and the sector's growth since 2021 have offset much of its earlier reduction.
Regulation status
| Field | Value |
|---|---|
| Last reviewed | 2026-08-01 |
| Based on | Regulation (EU) 2023/956, EU ETS Directive 2003/87/EC, Carbon Market Watch analysis (Union Registry data, 15 April 2026) |
| Applies to | CBAM permanent phase (2026+), ETS revision (July 2026) |
References
- Carbon Market Watch, Bad chemistry: how the chemical sector escapes EU carbon pricing
- EU Regulation 2023/956
- EU ETS Directive 2003/87/EC
- European Commission, CBAM
- IR (EU) 2025/2621
Last updated: August 2026 | Sources: Carbon Market Watch "Bad chemistry" (2026, Union Registry data extracted 15.04.2026), EU Regulation 2023/956, EU ETS Directive
Important Financial Disclaimer
The financial figures, cost estimates, and compliance scenarios discussed in this article are for informational purposes only. Actual CBAM liability depends on your specific import profile, verified emission data, and regulatory interpretations. Consult a qualified CBAM advisor or customs professional before making compliance decisions.
This article was researched and written with AI assistance. Figures and regulatory references are cross-checked against official EU sources (EUR-Lex, European Commission CBAM page) and updated when the rules change.
R. Emrah Gökkaya
I built CbamTrack because I saw SME exporters struggling with spreadsheets and confusing regulations. Every article here reflects what I've learned implementing IR 2025/2621-compliant calculations, integrating live EU ETS pricing, and building the emission factor database that powers our platform.
View full author bio →Ready to simplify your CBAM compliance?
Subscribe today and generate your first CBAM report in minutes.