CBAM Default Values & Markups 2026-2028
Key Takeaways
- This guide covers technical reporting requirements based on IR (EU) 2025/2621 and EU Regulation 2023/956
- All emission factors and CN codes referenced are verified against the latest EU implementing regulations
- Practical steps and common mistakes are drawn from hands-on implementation experience with the CbamTrack platform
From the team behind CbamTrack
We built this guide based on hands-on experience implementing CBAM compliance for SME importers. The calculations and workflows described here power our own platform — this is not theory, it's what we ship.
What default values are
When an importer can't provide verified actual emissions data, CBAM falls back on default values the European Commission publishes. These represent the typical emissions intensity of production in the country of origin. They're set high on purpose, and they carry a markup that increases every year.
The logic is straightforward: give us real data, or pay more.
"If there is no reliable data from a specific country, the average emission of the 10 countries with the highest emission intensities will be used." Luxembourg Administration de l'environnement, USEE ETS/CBAM webinar (17 December 2025)
The markup schedule
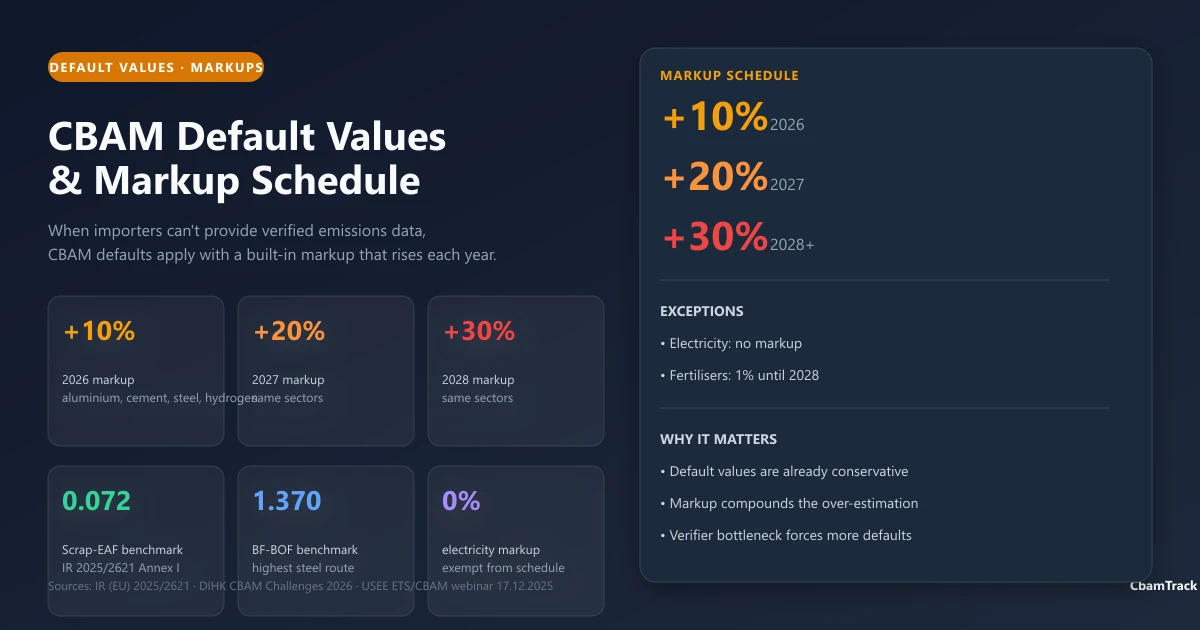
| Year | Markup | Sectors |
|---|---|---|
| 2026 | +10% | Aluminium, cement, iron & steel, hydrogen |
| 2027 | +20% | Same |
| 2028 | +30% | Same |
Two exceptions. Electricity imported into the EU carries no markup at all. Fertilisers get a gentler 1% rate until 2028, which reflects the political sensitivity around food prices.
The markup compounds the problem of already-high defaults. DIHK calls this out directly:
"The planned annual increases of 10, 20 and 30 per cent on the standard values, which are already calculated conservatively, further undermine the announced phased introduction of the CBAM." DIHK, CBAM Challenges 2026 (June 2026)
How default values are built
For each CN code, the Commission publishes a set of figures: direct emissions, indirect emissions, total, and the values including markup for 2026, 2027, and 2028. The underlying production route determines which benchmark applies.
The webinar walked through CN 76161000 (aluminium nails and tacks):
| Column | Value (tCO₂e/t) |
|---|---|
| Default (direct) | 2.49 |
| Default (indirect) | N/A |
| Default (total) | 2.49 |
| 2026 incl. 10% markup | 2.739 |
| 2027 incl. 20% markup | 2.988 |
| 2028 incl. 30% markup | 3.237 |
| Underlying route | (K) primary aluminium |
The production route letter in the table is what matters. (A) is grey clinker, (C) carbon steel BF/BOF, (D) carbon steel DRI/EAF, (E) carbon steel scrap/EAF, (F) low-alloy BF/BOF, (K) primary aluminium, (L) secondary aluminium. Each route maps to a specific benchmark under IR 2025/2621 Annex I. For instance, Route C (BF-BOF) carries a benchmark of 1.370 tCO₂e/t, while Route E (scrap-based EAF) is much lower at 0.072 tCO₂e/t. These numbers determine how much of your emissions get covered by free allocation and how much you actually pay for.
Why industry says they're too high
DIHK's June 2026 position paper lists four problems with the December 2025 default values:
- China and Indonesia values far exceed the JRC study used during the transitional phase, across a very large number of CN codes
- Supply switching is unrealistic. Companies can't move suppliers to lower-default countries at short notice
- The markup makes it worse. High defaults plus a 30% markup by 2028 undercut the gradual phase-in that was promised
- No verifiers exist before September 2026. Verification must happen between January and September 2027, so many companies end up in defaults even when they hold real data
That fourth point is the operational catch. You might have actual emissions data sitting in a spreadsheet somewhere, but if your supplier's installation isn't verified by an EU-accredited body, you can't use it.
"No testing bodies will be accredited before September 2026, but verification must be completed between January and September 2027." DIHK, CBAM Challenges 2026 (June 2026)
How benchmarks interact with defaults
CBAM benchmarks are based on the performance of the top 10% of EU installations. Benchmarks covering 2026 to 2030 come from the EU ETS system. Revised CBAM-specific benchmarks apply from January 2027. If the Commission finds benchmarks are too high or too low, it can revise them.
The CBAM factor, which determines how much free allocation you lose each year:
| Year | CBAM factor | Free allocation |
|---|---|---|
| 2026 | 2.5% | 97.5% |
| 2027 | 5% | 95% |
| 2028 | 10% | 90% |
| 2029 | 22.5% | 77.5% |
| 2030 | 48.5% | 51.5% |
| 2031 | 61% | 39% |
| 2032 | 73.5% | 26.5% |
| 2033 | 86% | 14% |
| 2034 | 100% | 0% |
The jump from 2029 to 2030 is where it gets painful. You go from losing about a quarter of your free allocation to losing nearly half in a single year.
Defaults versus actual data
| Approach | When it makes sense | Risk |
|---|---|---|
| Default values | Complex supply chain, no verified data, or verifier capacity unavailable | Pay markup (+10% to +30%), possibly over-pay vs. true emissions |
| Actual verified data | Suppliers can produce verified installation data by early 2027 | Verification bottleneck; suppliers must be certified |
The cost gap adds up. With a €75 certificate price, a 2.0 tCO₂/t product assessed at defaults versus 1.5 tCO₂/t with actual data can differ by tens of euros per tonne before the markup even applies. By 2034, at full phase-in, that difference is material for any importer at scale.
(We built a free calculator that runs both scenarios side by side. Might be worth checking before you commit to either path.)
Quick summary
- Default values are set conservatively high, based on worst-performing producers when country data is missing
- Markups rise +10% to +20% to +30% from 2026 to 2028. No markup on electricity; 1% for fertilisers
- China and Indonesia face the highest default values versus the transitional-period JRC benchmarks
- The production route letter in default tables determines which benchmark applies per country
- The verifier accreditation shortage forces many importers into defaults, even with real data available
Related: How to Calculate Embedded Emissions | CBAM Certificate Cost Formula | Reduce CBAM Costs
Frequently asked questions
When do corrected default values arrive?
The Commission is correcting some current values in 2026, with a full revision expected in 2027.
Is there a markup on electricity imports?
No. Electricity imported into the EU carries no markup.
Can I use my supplier's actual data instead of defaults?
Yes, but it must be verified by an EU-accredited verifier, and verification must be completed between January and September 2027. Note that all upstream suppliers' installations must be certified for actual data to be usable.
Regulation status
| Field | Value |
|---|---|
| Last reviewed | 2026-08-01 |
| Based on | IR (EU) 2025/2621 (default values and benchmarks), Regulation (EU) 2023/956 Annex IV |
| Applies to | CBAM permanent phase (2026+) |
References
- IR (EU) 2025/2621
- EU Regulation 2023/956
- DIHK, CBAM Challenges 2026
- Luxembourg Administration de l'environnement, USEE ETS/CBAM webinar (17 Dec 2025)
- European Commission, CBAM
Last updated: August 2026 | Sources: IR (EU) 2025/2621, DIHK CBAM Challenges 2026, USEE ETS/CBAM webinar 17.12.2025
This article was researched and written with AI assistance. Figures and regulatory references are cross-checked against official EU sources (EUR-Lex, European Commission CBAM page) and updated when the rules change.
R. Emrah Gökkaya
I built CbamTrack because I saw SME exporters struggling with spreadsheets and confusing regulations. Every article here reflects what I've learned implementing IR 2025/2621-compliant calculations, integrating live EU ETS pricing, and building the emission factor database that powers our platform.
View full author bio →Ready to simplify your CBAM compliance?
Subscribe today and generate your first CBAM report in minutes.